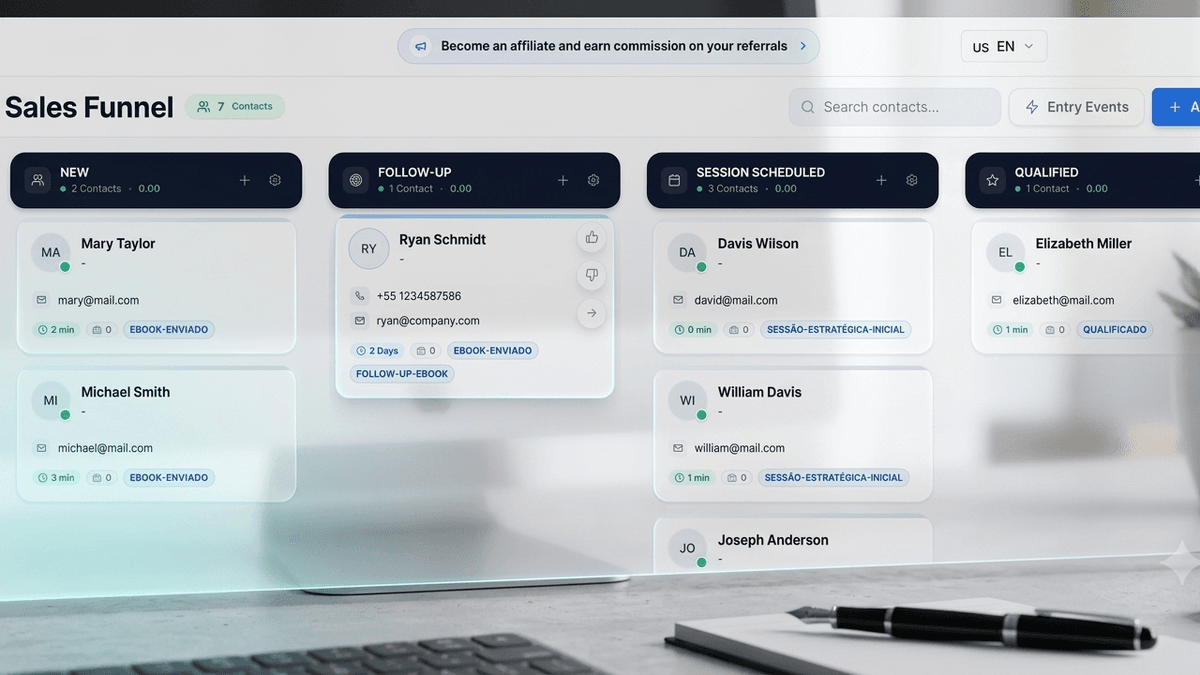
Most Deals Don't Get Lost. They Get Stuck.
Between 40% and 60% of qualified deals end in no decision rather than a loss to a competitor. Those deals stall in a specific stage of your funnel, and most CRMs never tell you which one. Here's how the Conversion Report in FlyB finds it, and why grouping by origin changes what you do next.
Ask a sales team who they lose to and you'll hear a competitor's name. Look at the data and a different answer shows up.
In the research behind The JOLT Effect, Matthew Dixon and Ted McKenna analyzed more than 2.5 million recorded sales conversations and found that somewhere between 40% and 60% of qualified deals end in no decision at all. The buyer doesn't pick you. They don't pick a rival either. They stop moving.
What makes this expensive is not the percentage. It's that a stalled deal doesn't look like a problem while it's happening. Nobody marks it as lost. It sits in the pipeline as an open opportunity, technically alive, quietly going nowhere. By the time anyone notices, the trail is cold and the reason is a guess.
That's the problem we built the Conversion Report to solve.
Totals are comfortable and useless
Most teams can answer two questions about their funnel: how many leads came in, and how many deals closed. Both numbers are easy to get and neither one tells you what to do on Monday.
If conversion drops from 12% to 8%, the totals confirm that something is wrong. They don't say whether leads are arriving worse, whether nobody is following up in the first hour, or whether proposals are going out and never coming back. Those are three completely different problems with three completely different fixes, and they all look identical from the top of the report.
You need the shape of the journey, not the endpoints.
What the Conversion Report shows
Open a funnel in FlyB, pick a period, and the report reads your pipeline from first contact to final outcome:
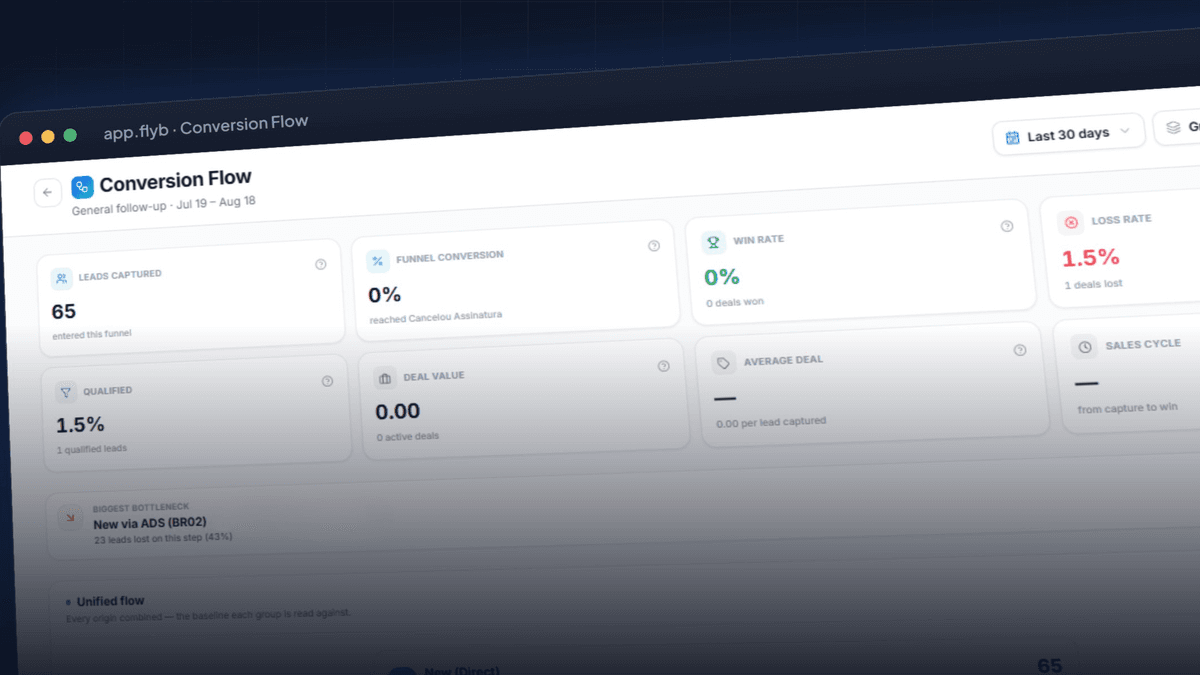
- Leads captured, and how many of them qualified
- Funnel conversion, win rate, and loss rate
- Total and average deal value per lead captured
- Sales cycle, measured from capture to win
- Stage by stage: how many leads advanced, how many stalled, how many are sitting there right now, and how many were lost at that exact point
The stage-level view is the part that changes conversations. A stage isn't just a count. It shows the percentage that moved forward, the percentage that stopped, and the average time it takes a lead to reach it. When a stage takes 20 days to reach and holds 43% of the leads that get there, you've found something specific enough to act on.
FlyB also names the single worst transition in the funnel for you, at the top of the report. Not the stage with the most leads, and not the one with the lowest count. The step where the largest share of leads stop advancing. It's usually not the step anyone would have guessed.
Grouping by origin is where it gets interesting
Here's the part we use most, and the reason a single funnel number is often misleading.
The same funnel rarely behaves the same way for every lead. Someone who arrives from a paid campaign, someone who found you through search, and someone referred by an existing customer are three different people with three different levels of intent, walking through the same stages at different speeds.
Group the report by origin and you get one flow per source, each read against the unified flow as a baseline. That turns a single bottleneck into a much sharper question: is this step broken, or is it only broken for leads coming from one place?
The answers tend to be uncomfortable in a useful way. A campaign can look excellent on volume and terrible on progression: plenty of leads captured, almost none making it past qualification. In a blended report, its volume props up the average and hides its own failure. Split by origin, it has nowhere to hide.
This also reframes the budget conversation. "Which channel brings the most leads" is a question about cost per lead. "Which channel's leads actually reach a decision" is a question about cost per customer. Only the second one is worth optimizing, and until now most teams have been answering it from memory.
What we found in our own funnel
We ran the report on FlyB's own pipeline before shipping it, which is the only honest way to test something like this.
Our worst transition was leads arriving from ads into the next stage: 43% of them stopped there. Not lost, not won. Parked. Twenty-three people sitting in one stage, none of them flagged as a problem by anything else we were looking at.
Nothing about that was visible in our totals. The lead count looked healthy. The loss rate looked almost suspiciously low, for the obvious reason: a deal nobody has given up on yet doesn't count as lost.
How to read your first report
A few things we've learned about getting a useful answer out of it:
Set the period to at least one full sales cycle. If your deals take a month, a seven-day window will show you a funnel full of leads that simply haven't had time to move yet. That's not a bottleneck, that's impatience.
Read the unified flow before you split it. Find the stage with the largest stalled percentage first, then group by origin to see whether the stall is spread evenly or concentrated in one source. Those two cases call for very different responses.
Let the position of the bottleneck pick the diagnosis. Early in the funnel, stalling usually means qualification or response time: leads arriving that were never a fit, or a fit that went unanswered too long. In the middle, it usually means follow-up depending on someone remembering to act. Late in the funnel, it's often the indecision Dixon and McKenna describe. In their research, most no-decision losses came from buyers who were afraid of choosing wrong, not buyers who loved the status quo. Those buyers don't need more urgency. They need the risk taken off the table.
Change one thing, then compare the same window next month. A report that tells you where the funnel leaks is only worth as much as the next reading you take after fixing it.
The data was already there
Your CRM has been recording all of this. Every stage change, every timestamp, every lead that arrived and went quiet. The Conversion Report doesn't add data, it makes the data answer a question.
And the question is a small one, which is why it's worth asking: which step in your funnel is holding leads right now, and for which channel?
Open a funnel in FlyB, set it to the last 30 days, and look at the bottleneck it names. Most people are surprised, and being surprised by your own funnel is the useful part.